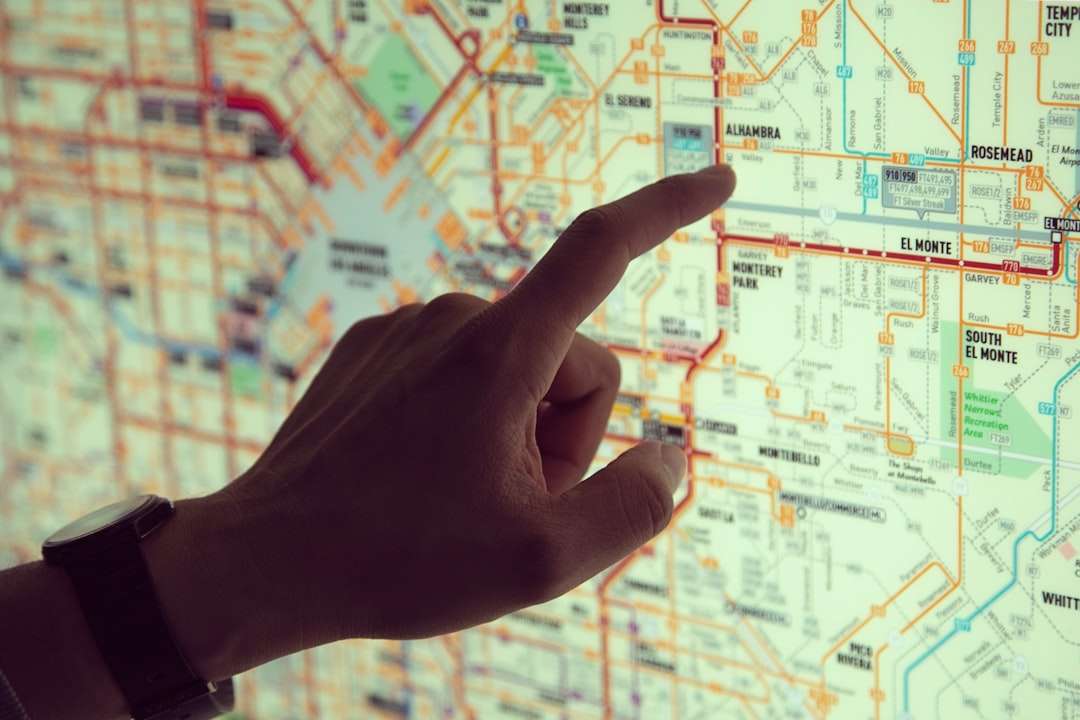
Maps are not just for directions anymore. They are powerful tools for thinking, planning, and solving problems. Today, geospatial mapping apps help businesses, researchers, students, and city planners understand the world in smarter ways. They turn raw location data into colorful, interactive stories. And the best part? Many of them are easy to use.
TLDR: Geospatial mapping apps help you analyze and visualize spatial data in simple, powerful ways. Tools like ArcGIS, QGIS, and Google Earth Pro offer different features for different needs. Some are beginner-friendly. Others are built for deep analysis. Choosing the right one depends on your goals, budget, and experience level.
Let’s explore seven geospatial mapping apps that make spatial data analysis easier and even fun.
1. ArcGIS Online
ArcGIS Online is one of the most popular mapping platforms in the world. It is built for both beginners and professionals.
You can create interactive maps in your browser. No heavy installation required. Just log in and start building.
- Create layered maps
- Analyze demographic data
- Share dashboards with teams
- Access thousands of public datasets
It is powerful but user-friendly. Many governments and universities use it. If you want advanced analysis without too much coding, this is a strong choice.
Best for: Businesses, city planners, educators.
2. QGIS
QGIS is free. And open-source. That means anyone can download and use it.
It may look complex at first. But once you get used to the interface, it becomes incredibly powerful.
- Perform advanced spatial analysis
- Work with many file formats
- Customize using plugins
- Create detailed, publication-ready maps
Because it is open-source, there is a large community behind it. You can find tutorials, forums, and extensions easily.
Best for: Researchers, analysts, and budget-conscious users.
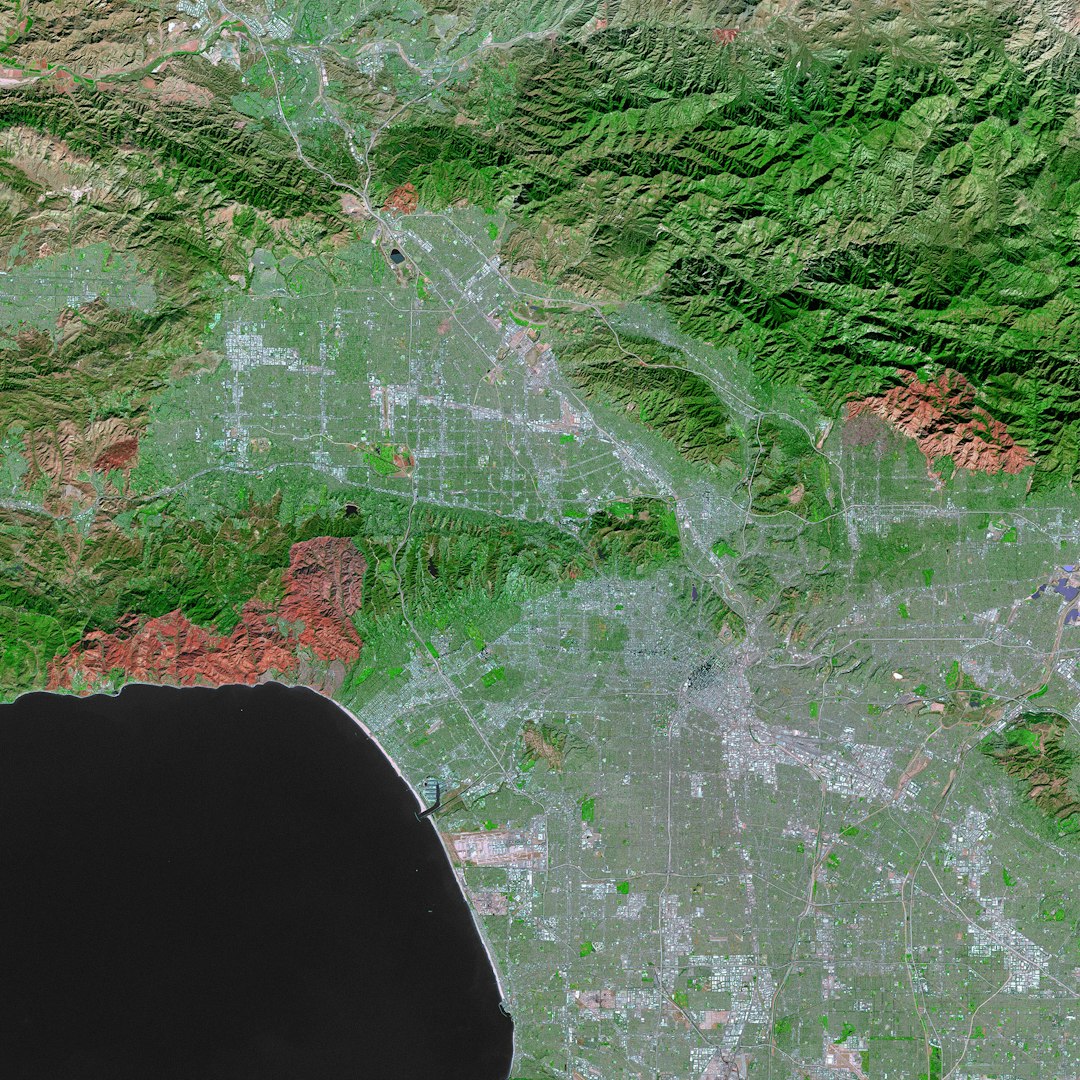
3. Google Earth Pro
Google Earth Pro brings the planet to your screen.
You can zoom from space into city streets in seconds. It is visual. Simple. And surprisingly powerful.
- Measure distances and areas
- Import GIS data
- Create tours and presentations
- View historical imagery
This tool is great for storytelling. It helps you show change over time. Urban growth. Deforestation. Coastal erosion.
It is not as advanced as other GIS platforms. But it is super accessible.
Best for: Presentations, schools, quick visual analysis.
4. Mapbox
Mapbox is built for developers and designers.
It allows you to create custom maps for websites and mobile apps. You can control colors, labels, fonts, and data layers.
- Real-time data visualization
- Custom map styling
- Navigation and routing features
- Strong API integration
If you want a beautiful, branded map experience, this is your tool.
It does require some coding knowledge. But the results are impressive.
Best for: App developers, startups, tech teams.
5. CARTO
CARTO focuses on location intelligence.
It helps businesses find patterns in spatial data. For example, where customers shop. Or where delivery delays happen.
- Cloud-based platform
- Strong spatial analysis tools
- Easy-to-use dashboards
- Big data integration
CARTO simplifies complex location analytics. It is especially good for business users who want insights fast.
Best for: Retail, logistics, marketing teams.
6. GRASS GIS
GRASS GIS is a powerhouse for scientific analysis.
It has been around for decades. And it is packed with advanced tools.
- Raster and vector analysis
- Terrain modeling
- Hydrological simulations
- Environmental impact studies
It is not as polished visually. But it is extremely capable.
This is the tool for deep research and environmental modeling.
Best for: Scientists, environmental engineers, academic research.
7. GeoDa
GeoDa is built for spatial data analysis and statistics.
It helps you explore patterns, clusters, and relationships across geographic areas.
- Spatial autocorrelation analysis
- Cluster detection
- Regression tools
- Simple, clean interface
It is often used in public health and social sciences. If you work with geographic statistics, this tool is very helpful.
Best for: Statisticians, public policy analysts, researchers.
Image not found in postmetaQuick Comparison Chart
| Tool | Cost | Ease of Use | Best For | Key Strength |
|---|---|---|---|---|
| ArcGIS Online | Paid | Medium | Businesses, cities | All-in-one mapping platform |
| QGIS | Free | Medium to Hard | Researchers | Powerful open-source tools |
| Google Earth Pro | Free | Easy | Education, presentations | Visual exploration |
| Mapbox | Freemium | Medium | Developers | Custom map design |
| CARTO | Paid | Medium | Business analytics | Location intelligence |
| GRASS GIS | Free | Hard | Scientific research | Advanced modeling |
| GeoDa | Free | Easy to Medium | Spatial statistics | Cluster and regression analysis |
How to Choose the Right Tool
Not every mapping app is right for every job.
Ask yourself a few simple questions:
- What is my goal? Visualization, analysis, or modeling?
- What is my budget? Free tools can be very powerful.
- How technical am I? Some tools require coding.
- Do I need collaboration? Cloud platforms make sharing easy.
If you are just starting out, try Google Earth Pro or GeoDa. If you need advanced analysis, explore QGIS or GRASS GIS. If you work in business, CARTO or ArcGIS Online may be better.
Why Geospatial Analysis Matters
Spatial data is everywhere.
It helps cities reduce traffic. It helps farmers grow food efficiently. It helps health officials track disease outbreaks. It helps companies choose store locations.
When you analyze location, you see patterns others miss.
For example:
- A retailer finds high-demand neighborhoods.
- A city identifies flood risk zones.
- A researcher maps climate change impact.
Maps turn numbers into meaning.
Final Thoughts
Geospatial mapping apps have changed the way we see the world. They make complex spatial data simple. Visual. Actionable.
You do not need to be a GIS expert to start. Many tools are beginner-friendly. And there are thousands of tutorials online.
Start small. Upload a dataset. Create your first layered map. Explore patterns. Zoom in. Zoom out.
The world is full of data. But with the right mapping app, that data becomes insight.
And insight leads to better decisions.
That is the real power of geospatial analysis.